- Summary: Challenges when interpreting trade records of a local cryptocurrency exchange #Foxbit
- Audience: Systems architects, JavaScript developers, Front-end developers, Back-end developers, Technical traders.
- Participants: Marcio S Galli
- Text Language: en-US
- Tags: Binance, API, trading, trade, JavaScript.
Introduction
This article assumes that you understand the basics of trading with cryptocurrency exchanges. As the user does multiple trades, buying and selling, the exchange will store records. In general, these records are provided for download and are useful for accounting or tax purposes.
The format for these records is not standardized. Therefore, it’s up to the exchange to decide about the format and its structure. Throughout the following sections, you will follow the steps to understand how one particular exchange has organized its trade history using a CSV file.
Our goal is to understand the file structure, and then we will move to parsing the data and generating a JSON output which is a more flexible file format for manipulation by software.
Understanding the CSV file and the format structured
The following sections, and the companion example, are particular to Foxbit — a Brazillian Cryptocurrency exchange.
I didn’t ask them why CSV, but I can assume that they did it because a) CSV is text-based, and b) each line can show multiple values separated by a comma. The simplicity of this format allows, for example, anyone to import it to popular spreadsheet systems. Foxbit has published a how-to article that explains how to import the CSV in a spreadsheet. Let’s celebrate how this CSV looks like if you import it in a spreadsheet:
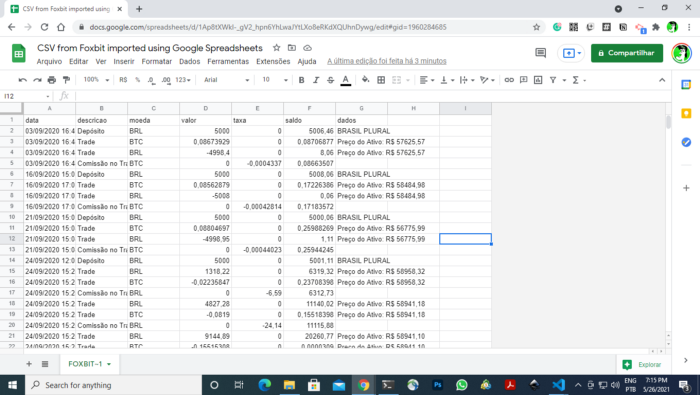 Example of a CSV file CSV-Foxbit-version1 imported using Google Spreadsheets
Identifying each trade (described by a triple)
The following is a small piece taken from a CSV file that you find in the references section. Consider the first five lines, which refers to a header line, a deposit, and one trade (in bold) described by three lines:
data,descricao,moeda,valor,taxa,saldo,dados
03/09/2020 16:41:28,Depósito,BRL,"5000,00000000","0,00000000","5006,46000000",BRASIL PLURAL
03/09/2020 16:44:26,Trade,BTC,"0,08673929","0,00000000","0,08706877","Preço do Ativo: R$ 57625,57"
03/09/2020 16:44:26,Trade,BRL,"-4998,40000000","0,00000000","8,06000000","Preço do Ativo: R$ 57625,57"
03/09/2020 16:44:26,Comissão no Trade,BTC,"0,00000000","-0,00043370","0,08663507",
The first line is just a header — it attempts to explain what each line is about. Data is date, descricao is description, moeda is asset type, valor is value, taxa is fee, saldo is balance, and data is the field for additional comments.
data,descricao,moeda,valor,taxa,saldo,dadosRemoving that, you will get the following line that shows a deposit. At 16:41, meaning that an amount of money, 5000.00 BRL, was deposited in the exchange, the total balance went up to 5006,46 BRL. Therefore, this data shows that the user account had 6.46 BRL in it already.
03/09/2020 16:41:28,Depósito,BRL,"5000,00000000","0,00000000","5006,46000000",BRASIL PLURALThe following three lines explain a trade — one processed at 16:44. The word “trade” can be confusing. It’s more like a side operation that is part of the trade.
03/09/2020 16:44:26,Trade,BTC,"0,08673929","0,00000000","0,08706877","Preço do Ativo: R$ 57625,57"
03/09/2020 16:44:26,Trade,BRL,"-4998,40000000","0,00000000","8,06000000","Preço do Ativo: R$ 57625,57"
03/09/2020 16:44:26,Comissão no Trade,BTC,"0,00000000","-0,00043370","0,08663507",
The first line means that 0.08673929 BTC was bought, and that the new balance became 0.08706877 BTC. Therefore, this user account had (0.08706877- 0.08673929) BTC before this event. Notice that the 5th attribute, the fee attribute, is not being used. Yes, it is confusing that it shows the value of “0,00000000”. You can ignore that. I would prefer if the field were something like “NA” instead of “0,00000000”. You will see that the commission fee is described in the 3rd line anyway.
The second line refers to the payment in BRL. It tells us that -4998.40 BRL was taken from the user account, which resulted in a balance of 8.06 BRL. This example can be confusing (why would one leave 8.06 in there) but it’s something that can happen. I am not judging the data in this article.
The third line indicates the actual commission fee of 0.0004337 BTC applied in this transaction. This fee was based on the buy event’s total amount, the value of 0.08706877 BTC from the first line, resulting in a balance of 0.08663507 BTC.
Organizing as events
From an accounting perspective, three meaningful events happened at the same time. For more meaningful storytelling, let’s adjust the order:
EVENT A, 4998.00 BRL was taken from the account, in order to buy BTC , resulting in a balance of 8.06 BRL — 03/09/2020 16:44:26,Trade,BRL,”-4998,40000000",”0,00000000",”8,06000000",”Preço do Ativo: R$ 57625,57"
EVENT B, 0.08673929 BTC was acquired, resulting in 0,08706877 BTC — 03/09/2020 16:44:26,Trade,BTC,"0,08673929","0,00000000","0,08706877","Preço do Ativo: R$ 57625,57"
EVENT C, A fee was taken, in BTC, calculated based in amount that was acquired (0.08673929 BTC), resulting in 0.00043370 BTC to be deducted from the total balance of 0.08706877 BTC, which resulted in 0.08663507 BTC in the user’s account — 03/09/2020 16:44:26,Comissão no Trade,BTC,”0,00000000",”-0,00043370",”0,08663507",
Challenges to parse each trade (optional)
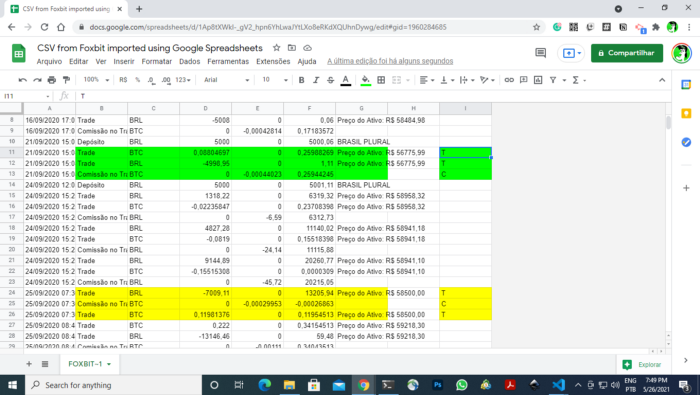
You may opt-out here, but I had to deal with challenges to parse these trades if you are curious. My initial assumption was that the order was strict with three lines describing a trade: Trade operation, Trade operation, Commission Fee. I am calling this order a TTC order.
But when trying to parse it, I found that triples would appear in different orders, such as TTC or TCT. The following screenshot shows this challenge:
The solution — buffering lines until a criteria is met
A possible solution is to read lines until the expected lines are in place. After having found two trade operations and one commission, when all conditions are in place, it is time to prepare the Trade data.
Towards our goal
Our goal is to generate an output that is as informative as possible about each trade. With that, consider the following main main descriptors:
“from” — represents the asset that was given.
“to” — represents the asset that was taken.
“fee” — represents the comission taken after the operation was performed.
To understand the direction, buy or sell, I learned when the trade commission is applied. The commission is taken after the operation happens. Therefore, for example, if you buy BTC using BRL, the fee is taken from BTC. Likewise, if you sell BTC, the fee is taken from your BRL balance.
Therefore, the information about the direction can come from the commission line. In the following example, the commission line indicates that the operation used BRL to buy BTC:
- 16:44:26,Comissão no Trade,BTC,”0,00000000",”-0,00043370",”0,08663507",
Therefore, the “from” object can be formed from the Trade operation with the BRL instrument. Conversely, the “to” object is formed from the other operation. In other words, it does not matter the order anymore, as the code shows:
if(tradeCurrent.out.fee.instrument == tradeCurrent.in.csvLineTradeTmp1Instrument) {
tradeCurrent.out.from = parseInstrument(tradeCurrent.in.csvLineTradeTmp2);
tradeCurrent.out.to = parseInstrument(tradeCurrent.in.csvLineTradeTmp1);
} else {
tradeCurrent.out.from = parseInstrument(tradeCurrent.in.csvLineTradeTmp1);
tradeCurrent.out.to = parseInstrument(tradeCurrent.in.csvLineTradeTmp2);
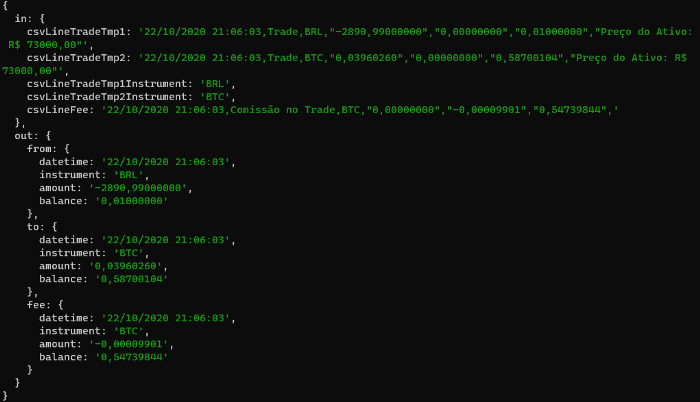
}Our JSON
For the sake of accountability, I have decided to keep the raw data preserved inside the JSON object. For each trade, our output object is divided into two parts. “In” and “out”. The “in” holds the collected lines from the CSV. The “out” object is a placeholder for our result structure.
Conclusion
I hope that this overview can be helpful to you, assuming that you are interested in processing record files associated with trades. Although this conversion is not a complex project, my goal was to expose ideas to help understand how the data is generally structured and told by exchanges. Now, taking it from here, developers can make calculations on top of the data, such as the average buy price; and move towards a more complex solutions.
References
- How to import Foxbit CSV files (portuguese-BR)
- Sample code — CSV to JSON converter for Foxbit CSV
- CSV test file 1— from the code samples repository
- CSV test file 2— from the code samples repository
- CSV test file 3— from the code samples repository
- CSV test file 4 — from the code samples repository
Appendix 1 — Main converter sample code
Please check the github.com/taboca/article-sample-code-parsing-svg-trades-record-foxbit-2020 to see the full source code based on 4 different input test files. These input testfiles were created based in real challenges that I have found.
Final remarks
This article was published at The Geek Culture from the activities of learning and work hours as I am learning how to access exchanges using their APIs. I know that this is not much, it’s a baby step, on its way towards accounting work. It should help with calculation of taxes. It was my goal to capture the challenges and provide insights about how trades are structured. I am in no way affiliated with Foxbit. Private note: this article was produced based on my own meetings with ids: c09cc72e-71d4–4e33–8976–2d6ec1825242, 3799397b-b1b9–4a1c-9160-c0ff8196cb45, bf33a32c-322a-4000-bd4a-8c7eccca0aa4, and 0f60dd1b-a6e2–42e3–9fbb-97b90b0d2037.